Panel 0.13.0 Release
release
panel
Release announcement for Panel 0.13
What is Panel?
Panel is an open-source library that lets you create custom interactive web apps and dashboards by connecting widgets to plots, images, tables, and text - all while writing only Python!
Panel integrates seamlessly with your existing work:
- Your code: Step into Panel with your existing work :) Continue to use the PyData ecosystem that you already know and love: matplotlib, seaborn, ggplot, bokeh, plotly, altair, echarts, holoviews, dask, datashader, and more!
- Your workflows: Move the same code freely between a Jupyter Notebook (or other interactive prompt), your IDE, and a fully deployable standalone server. Easily switch between exploring your data, building visualizations, adding custom interactivity, sharing with non-technical users, and back again at any point, using the same tools and code throughout.
Please check out the Panel website to find out more.
New release!
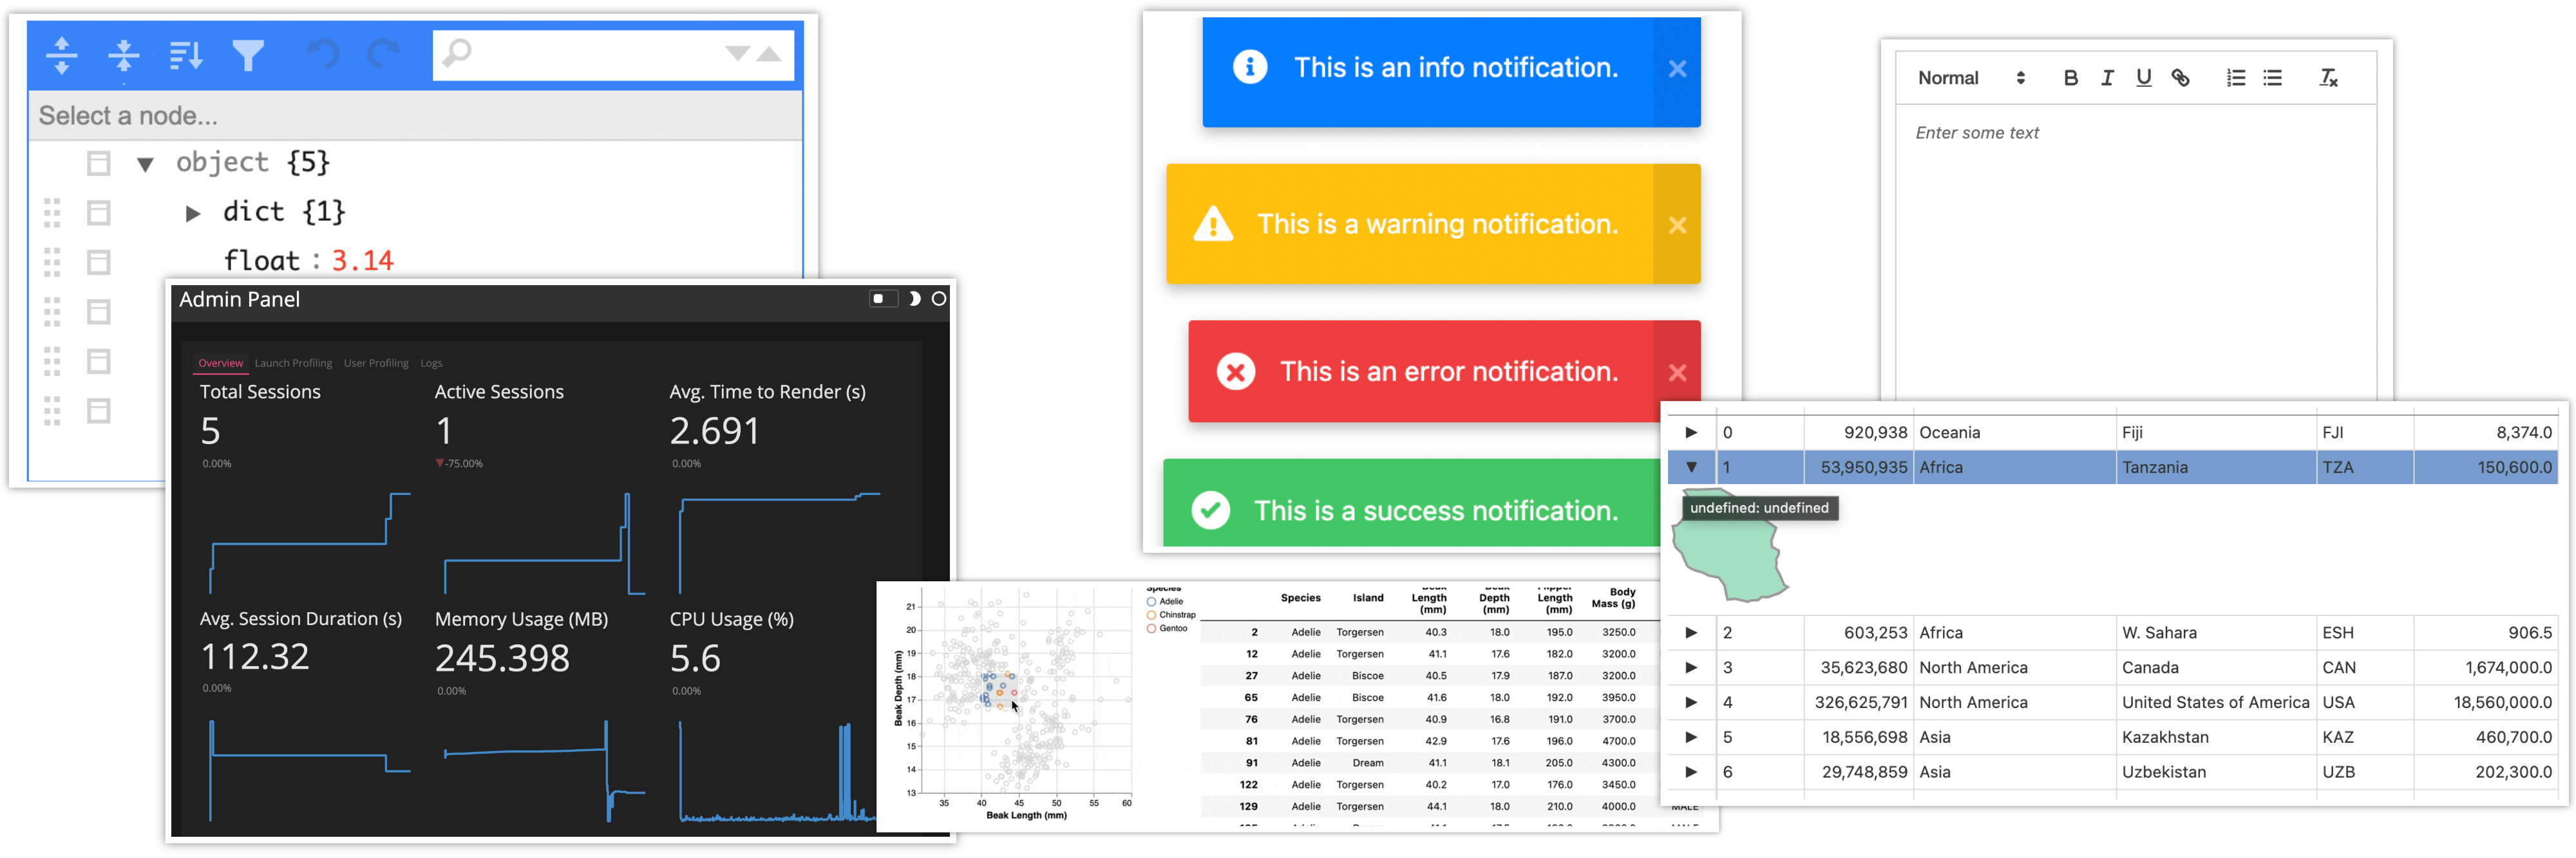
We are very pleased to announce the 0.13 release of Panel! This release focuses on adding a number of powerful features requested by our users, including:
- Major new features for the
Tabulatorwidget:- Client-side header filters
- Expandable rows
on_clickandon_editcallbacks
- Add support for listenting to events on
Vegapane - Add
JSONEditorandTextEditorwidgets - Add ability to display notifications in toasts
- LaTeX rendering now supported in
MarkdownandHTMLpanes - Ability to schedule recurring tasks independent of any running applications
- An admin dashboard to allow you to monitor, debug and profile your applications
- Support rendering Panel objects in Jupyterlite and Pyodide
- Built-in threading
- Easily extend Panel with your own components and Templates
- A code-of-conduct was added
However, as Panel is moving towards a 1.0 release the large number of bug fixes are almost of equal importance. For a full overview of the changes in this release view the release notes.
Many, many thanks to everyone who filed issues or contributed to this release. In particular we would like to thank @nghenzi, @Stubatiger, @hyamanieu, @samuelyeewl, @ARTUSI, @pmav99, @Prashant0kgp, @L8Y, @ingebert, @rahulporuri, @lemieux, @blelem, @raybellwaves, @sdc50, @sophiamyang, @gnowland, @govinda18, @maartenbreddels, @andriyor, @j-r77, @robmarkcole, @douglas-raillard-arm, @Kadek, @joelostblom for contributing various fixes and improvements. Special thanks for the growing list of core contributors and maintainers including @jbednar, @xavArtley, @Hoxbro, @philippjfr, @maximlt, @MarcSkovMadsen and @philippjfr for continuing to push the development of Panel.
If you are using Anaconda, you can get the latest Panel with conda install -c pyviz panel , and using pip you can install it with pip install panel.
Tabulator improvements
A powerful data grid is one of the most essential components in any data centric application. The Tabulator widget introduced in Panel 0.12 has received a ton of attention and new features making it even more powerful. We will highlight some of these features here, but as a whole Tabulator has become one of the most advanced and powerful components in Panel and has matured significantly.
Client-side filtering
Tabulator has had the ability to add filters since it was added to Panel, however these always required attaching separate widgets and required a connection to a server. In this release we added client-side filtering which renders the filters in the header and handles the filtering entirely within the browser (unless pagination='remote' is set). As an example below is a client-side filtering specification for the IMDB movie database (try entering filters in the header fields) and visit the website to find out more.
movie_filters = {
    'Title': {'type': 'input', 'func': 'like', 'placeholder': 'Enter title'},
    'Year': {'placeholder': 'Enter year'},
    'Genre': {'type': 'input', 'func': 'like', 'placeholder': 'Enter genre'},
    'Director': {'type': 'input', 'func': 'like', 'placeholder': 'Enter director'},
    'Writer': {'type': 'input', 'func': 'like', 'placeholder': 'Enter writer'},
    'imdbRating': {'type': 'number', 'func': '>=', 'placeholder': 'Enter minimum rating'}
}

widths = {'Title': '20%', 'Writer': '40%', 'Year': '7.5%', 'Genre': '15%', 'Director': '10%', 'imdbRating': '7.5%'}

filter_table = pn.widgets.Tabulator(
    movies_df, pagination='local', page_size=10, sizing_mode='stretch_width',
    header_filters=movie_filters, show_index=False, widths=widths
)
filter_table
Expandable rows
A table by its nature is a way to quickly summarize some data but it doesn’t lend itself to viewing a lot of text, embedding plots or anything else that takes up a lot of space. Therefore we added the ability to declare a row_content function. This function is given the row to be displayed and should return some other Panel object or object that can be rendered by Panel. As a straightforward example we will use the geopandas library to load geometries corresponding to different countries. Instead of rendering the coordinates of the geometry in the table we render the geometry into each row’s contents. If we expand the row by clicking the ► character we can see the geometry:
import geopandas as gpd

world = gpd.read_file(gpd.datasets.get_path('naturalearth_lowres')).iloc[:25]

pn.widgets.Tabulator(
    world, row_content=lambda row: row.geometry, pagination='local', page_size=10,
    embed_content=True, hidden_columns=['geometry'], expanded=[1, 3]
)
For more detail see the Tabulator reference guide.
on_click and on_edit callbacks
Watching the table value and selection parameters has allowed users to pick up on edits in the table. However until now there was no way to determine the exact cell that was clicked on or edited. Using the new on_click and on_edit callbacks this is now possible.
table = pn.widgets.Tabulator(pd._testing.makeMixedDataFrame())

md = pn.pane.Markdown(width=400)

table.on_click(lambda e: md.param.update(object=f'Clicked row {e.row}, column: {e.column}'))
table.on_edit(lambda e: md.param.update(object=f'Edited row {e.row}, column: {e.column}. New value: {e.value}'))

pn.Row(table, md);
Vega events
Vega(-lite) and its Python wrapper altair are extremely popular and powerful visualization tools. In the past it was however not possible to interact with Vega/Altair charts interactively. In this release we have added support for Vega events making it possible to observe selections on a Vega chart, which allows fully interactive Vega plots launching Python code on clicks. To initialize a selection we can create a so called selection_interval in altair, give it a name and add it to our altair chart using the add_selection method:
brush = alt.selection_interval(name='brush')  # selection of type "interval"

chart.add_selection(
    brush
)
Subsequently the Vega pane will reflect all selections on the chart on the vega_pane.selection.<name> parameter allowing us to watch the parameter and updating other components interactively in response, e.g. below we are simply linking a selection on the chart to a text pane which prints the current selection. Try selecting something and watch the text update:
Since the example below requires a live server we will not include an interactive version but observe how easy it is to link the Vega chart to the table:
import pandas as pd

df = pd.read_json("https://raw.githubusercontent.com/vega/vega/master/docs/data/penguins.json")

brush = alt.selection_interval(name='brush')  # selection of type "interval"

chart = alt.Chart(df).mark_point().encode(
    x=alt.X('Beak Length (mm):Q', scale=alt.Scale(zero=False)),
    y=alt.Y('Beak Depth (mm):Q', scale=alt.Scale(zero=False)),
    color=alt.condition(brush, 'Species:N', alt.value('lightgray'))
).properties(
    width=250,
    height=250
).add_selection(
    brush
)

vega_pane = pn.pane.Vega(chart, debounce=10)

def filtered_table(selection):
    if selection is None:
        return '## No selection'
    query = ' & '.join(
        f'{crange[0]:.3f} <= `{col}` <= {crange[1]:.3f}'
        for col, crange in selection.items()
    )
    return pn.pane.DataFrame(df.query(query), width=600, height=300)

pn.Row(vega_pane, pn.bind(filtered_table, vega_pane.selection.param.brush));
Notifications
Another feature we have seen users request frequently is the ability to surface notifications to a user. Using the inbuilt notification system (built on notyf.js) you will now have the ability to pop up “toasts” to a user either permanently or with a specified timeout. Using the pn.state.notifications API we can easily pop up notifications:
pn.state.notifications.error('This is an error notification.')
pn.state.notifications.info('This is a info notification.')
pn.state.notifications.success('This is a success notification.')
pn.state.notifications.warning('This is a warning notification.')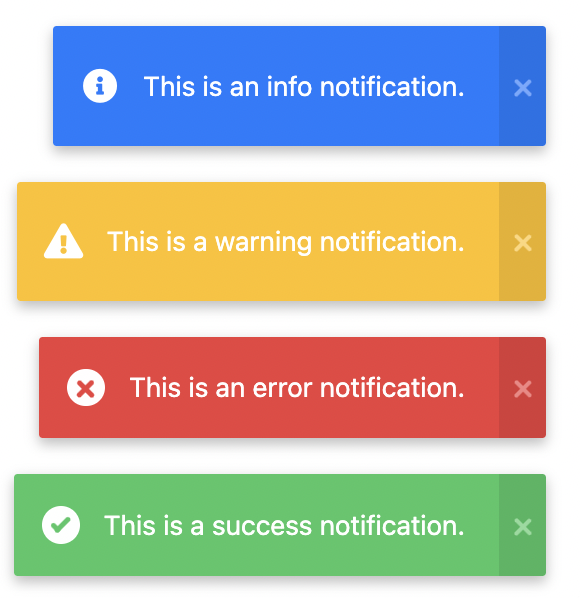
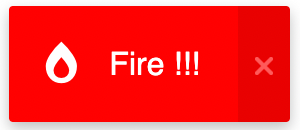
and even generate custom notifications:
pn.state.notifications.send(
    'Fire !!!', background='red', icon='<i class="fas fa-burn"></i>'
)
Try out yourself with the demo below:
pn.io.notifications.NotificationArea.demo()Rich text and JSON editors
Previous versions of Panel had widgets to edit text and more complex data structures. However, to afford more advanced rich text editing and provide more control over edits to Python lists and dictionaries or JSON data structures this release includes both a TextEditor and a JSONEditor.
TextEditor
The new TextEditor widget is built on top of the Quill.js library, which provides a clean but very powerful WYSIWYG rich-text editor that returns HTML strings. Play around with the editor below:
editor = pn.widgets.TextEditor(placeholder='Enter some text')

pn.Row(editor, editor.controls(['mode', 'placeholder', 'value'], sizing_mode='fixed'))
JSONEditor
The JSONEditor widget is built on the jsoneditor library and provides an extremely powerful and flexible editing experience for JSON and JSON-like data structures. This includes the ability to define schemas, type validation, multiple editing modes and more. Play around with it below:
json_editor = pn.widgets.JSONEditor(value={
    'dict'  : {'key': 'value'},
    'float' : 3.14,
    'int'   : 1,
    'list'  : [1, 2, 3],
    'string': 'A string',
}, width=400)

pn.Row(json_editor, json_editor.controls(['menu', 'mode', 'selection', 'value']))
LaTeX rendering
In the past Panel shipped with a custom LaTeX pane that allowed you to render snippets of LaTeX expressions, however this required laying out text and LaTeX separately. Recent releases of Bokeh have include a MathJax bundle, which has allowed us to support LaTeX embedded in Markdown and HTML panes delimited by double $ delimiters:
pn.pane.Markdown("""
- Markdown panes now support $$LaTeX$$
- To render a snippet with LaTeX add two $ delimiters
- e.g. $$\sum_{j}{\sum_{i}{a*w_{j, i}}}$$
""", width=800)
Support rendering Panel objects in Jupyterlite (& Pyodide)
JupyterLite is a version of Jupyter notebook that runs entirely in the browser without a server backing it. This makes it incredibly easy to share your applications and build demo material as it is now possible to share your running code and apps with no server. With this release Panel will have full support for both JupyterLite and Pyodide.
Visit a live deployment of JupyterLite with various Panel examples: PaneLite. Look forward to full support for building Panel application that run entirely in your browser without any server backing it.
An admin dashboard to allow you to monitor, debug and profile your applications
When building Panel applications you often want to have some high-level information about your deployment. For this reason we have built an admin dashboard which can be enabled out-of-the-box which includes a number of features:
- High-level user and resource usage statistics about your deployment
- The ability to profile your application using tools like
pyinstrumentandsnakeviz - Logging user interactions
The /admin endpoint can be enabled very easily with the --admin commandline option to the panel serve command.
Overview
The overview page provides information about resource usage and visiting users:
Timeline
The admin timeline page provides a timeline of user sessions and the callbacks triggered by user interaction:
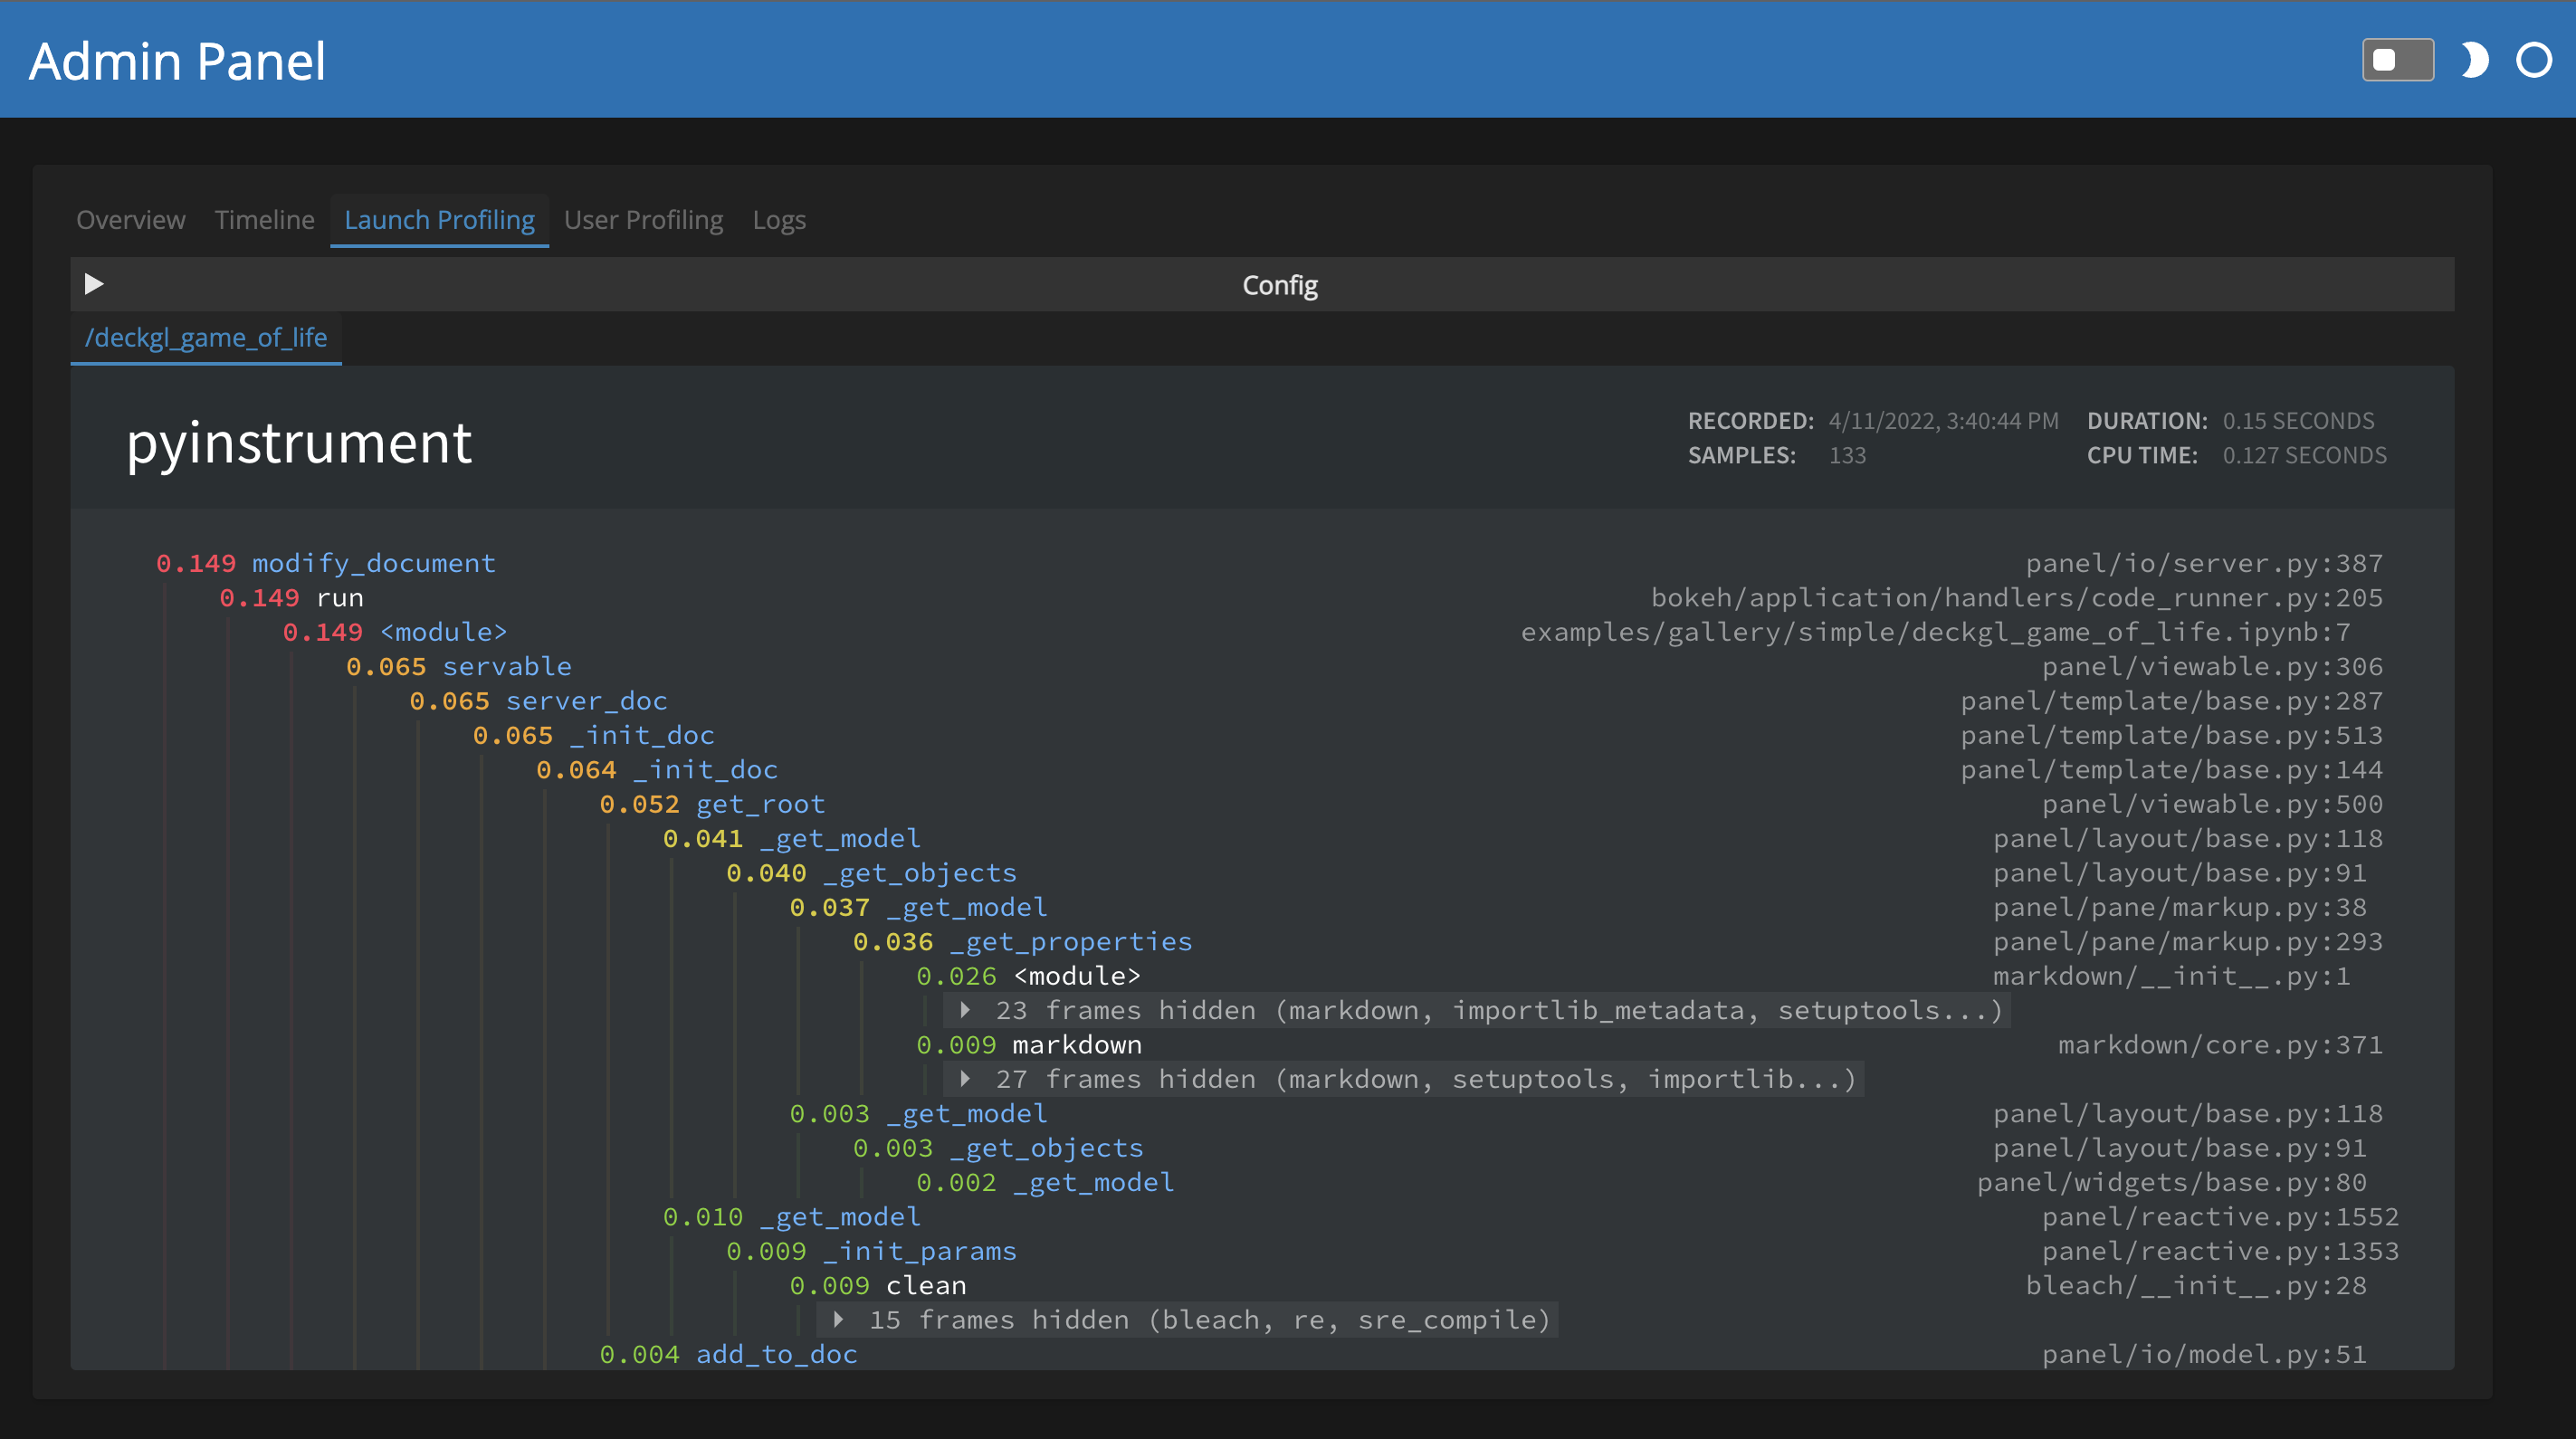
Profiling
The profiling page integrates with the new panel.io.profile decorator to surface profiling reports currently with support for snakeviz and pyinstrument:
Task scheduling
The ability to schedule periodic callbacks has made it possible to build streaming applications in Panel since its inception. However these callbacks are tied to a particular session, which has made it very difficult to coordinate tasks across multiple sessions or to perform actions independently from any particular user visiting the application. Using the new pn.state.schedule_task method we can now schedule tasks independently of any particular session. Global tasks are useful for performing periodic actions like updating cached data, performing cleanup actions or other housekeeping tasks, while periodic callbacks should be reserved for making periodic updates to an application.
To set up global tasks you can now provide a --setup option to panel serve with a script that configures the tasks to run. Tasks can be scheduled with a period, a cron schedule specification (if the croniter library is installed) or a function which is called to return the next time to schedule the task at.
import datetime as dt
import asyncio

async def task():
    print(f'Task executed at: {dt.datetime.now()}')

pn.state.schedule_task('task', task, period='1s')
await asyncio.sleep(5)

pn.state.cancel_task('task')
Built-in threading (experimental)
The scalability of Panel is of huge concern to developers and users alike, in the past there were only two main options for scaling applications. Either you used the inbuilt --num-procs N option to fork the application into multiple processes or the even more complex route of launching multiple instances of the application behind a reverse proxy. To provide more scalability out-of-the-box without having to launch multiple instances of the application we now support the ability to automatically dispatch user interactions to multiple threads. In the background Panel will start up a ThreadPoolExecutor if you launch the application with the --num-threads N and dispatch user interactions to the different threads. Note that this is only useful if the application code releases the GIL, i.e. performs I/O bound operations or invokes computations that themselves release the GIL.
Easily extend Panel with your own components and Templates
Building your own components and templates has been possible for a while but including local JS and CSS resources has been difficult. This release of Panel adds an endpoint to the Panel server that automatically serves any resources listed in the __js__, __css__ and other resource related variables on ReactiveHTML, BasicTemplate and Theme components.
Added a code of conduct
Thanks to Marc Skov Madsen we now have a code of conduct. To report CoC violations contact coc@holoviz.org.
Other enhancements
Components
- Editable sliders’
namecan be changed (#2678) - Make
Plotlypane resize when window resizes (#2704) Viewerobjects can now be used withpn.serve(#2769)VTKimprovement for NaN handling (#2826)- Add support for configuring
Vegaoutput (#2846) - Add a
groupsparameter toSelectwidget (#2876) - Add
Card.hide_headeroption (#2947) - Support
bytesandpathlib.Pathobjects onImagepanes (#2963, #3294) - Add programatic control over
Playerwidget (#2970, #2994) - Add alphabetical and custom sort to
Param(#2986) - Add
autoplayandmutedtoAudioandVideo(#3053) - Add a
disabled_optionsparameter to a customSelectwidget (#3067) - Expose the
orientationparameter of the button group widgets (#3083) - Add support for rendering pandas styler objects (#3152)
Viewernow better at working withdependsfunctions (#3159)- Make
Param.mappingpublic (#3173) - Improve support for jinja2 loops in
ReactiveHTML(#3236) - Add ability to require explicit load of
ReactiveHTMLextension (#3254) - Improve datetime handling of sliders (#3276)
- Add support for multiple files in
FileInput.save(#3300) - Add improved
Tabsmodel that resolves sizing and hover issues (#3301, #3321, #3329)
Tabulator
- Add support to expand rows in
Tabulator(#2762, #2837, #3010, #3163) - Implement client-side filtering on
Tabulator(#2815, #3298) - Add
Tabulator.header_alignparameter (#2861) - Implement
Tabulator.on_editcallbacks (#2887, #3209, #2958) - Implement DateEditor and DatetimeEditor for
Tabulator(#2899, #3008) - Implement
Tabulator.buttons(#3111) - Redesign
Tabulator.styleshandling (#3175) - Set default alignment for
Tabulator(#3194) - Bidirectionally sync
Tabulator.sorters(#3217) - Add support for setting percentage widths on
Tabulatorcolumns (#3239) - Add
Tabulator.on_clickcallback (#3245) - Restore
Tabulatorscroll position after patch (#3273) - Enable max row limits for
Tabulator(#3306)
Notebook
General improvements
- Warn users if extension is not loaded before server page is rendered (#2766)
- Sync URL location hash interactively (#2982)
- Change accent and header background color for Fast Templates (#2984)
- Add thread safety and TTL to
pn.state.as_cached(#3198) - Add py.typed file to support mypy (#3055)
- Handle authentification errors (#3096)
- Support saving png to file-like objects (#3155)
- Check if there are any query parameters in
baseurland adds it tolocation.searchif possible (#3214) - Improve handling of
--indexCLI argument (#3221) - Fix event dispatch (#3231)
- Add azure oauth v2.0 endpoint support (#3224)
- Ensure
gc.collectis not excessively called (#3259) - Added
panel.reactiveandpanel.viewableto namespace (#3157) - Consistent handling of page title (#3290)
Roadmap
This release has included a ton of great features and likely marks the last minor release before the Panel 1.0 release. Note that 1.0 will introduce major changes and we will be looking to you to provide feedback and help test the release. So look out for announcements of alpha, beta and release candidate releases and help make sure Panel 1.0 will be the success we hope it will be.
Documentation & Website
The Panel documentation has slowly evolved over time with new content and material added whenever new features were added. This means that we never did a full review of the documentation and considered how best to introduce users to the fundamental concepts. Before the 1.0 release we are planning to do a complete overhaul of the documentation and modernize the website.
Exporting to WASM
As highlighted above we now have support for running Panel applications entirely in the browser via Jupyterlite and Pyodide. In the future we hope to extend this support to directly export your existing Panel applications to a standalone HTML file that will run your Python application entirely clientside in your browser.
Native applications
Thanks to recent collaboration with the brilliant folks at Quansight and the Beeware project we have a basic prototype for running Panel apps in a native application. We hope to integrate this work into Panel to eventually allow you to build installers for the major operating systems (Linux, OSX and Windows) and hopefully also mobile platforms including iOS and Android.
Rewrite of the layout engine
Panel is built on top of Bokeh which was originally a plotting library but included an extremely powerful server architecture that has allowed us to build this entire ecosystem on top of. One of the legacies of Bokeh being primarily a plotting library was that it included a layout engine to ensure plots could be easily aligned. Unfortunately this also had severe downsides, specifically since this so called “managed layout” had to perform expensive computations to measure the size of different components on the page. This is why when you build complex nested layouts using rows, columns and grids you could sometimes slow down your application.
Bokeh has now begun replacing this managed layout with a CSS based unmanaged layout, which will free us from the performance bottlenecks of the past. This will result in a bright new future for Panel but it may also be also be a little disruptive in the short term. As soon as development versions of Bokeh 3.0 and Panel 1.0 are available we would therefore appreciate if you could provide us with feedback about any regressions related to layouts in your own applications so we can minimize the upgrade path.
CSS & Styling
Another major change resulting from the upgrade to Bokeh 3.0 will be in the way styling is managed. In the past you had the ability to modify styling of Panel/Bokeh components by constructing somewhat brittle CSS rules. This will now be a thing of the past as we will expose the stylesheets for all components directly in Python. This will afford much greater and simplified control over the styling of components but will also disrupt anyone who relied on applying CSS stylesheets directly. We again hope to minimize the disruptions related to this change and will provide a detailed migration guide.
Help us!
Panel is an open-source project and we are always looking for new contributors. Join us the discussion on the Discourse and we would be very excited to get you started contributing! Also please get in touch with us if you work at an organization that would like to support future Panel development, fund new Panel features, or set up a support contract.
Sponsors
Many thanks to our existing sponsors:

|

|
|